Project Introduction
I have owned a Raspberry Pi for a few years now, and outside of XMBC I haven't done much with it. When I purchased it, I had the intent to do some cool electronic experiments but never tried. A perfect sample project sprang up when my 2 year old son started to wake up in the middle of the night sweating because his room is too hot. We keep our thermostat set at 72 degrees almost all the time, but our upper level stays quite warmer than the main level. So in order to find the perfect thermostat setting I decided to build a temperature monitor that I can place in the boy's room and find the right setting.
Parts List
Here are the parts you will need for this project:
- (2) XBee Series1 Wireless Units
- (1) XBee Explorer USB Board
- (1) TMP36 Analog Temperature Sensor
- (1) XBee Breakout Board
- (1) Raspberry Pi Model B
- Jumper Wire, Breadboards, USB Cables, GPIO Cable
- Optional: Solder, Project Box
Part One - Programming the XBee's
Once all the parts arrive, we are going to use the USB Explorer board to connect our Xbee's to a computer and program them. The USB board provides the computer with a serial interface to the Xbee. We will use simple Serial AT Commands to program the Xbee. In order to get started you will need to download and install these your platforms FTDI drivers.
On my mac I used Cool Term to send AT commands to the Xbee's. I simply connected the first xbee into the USB Explorer then plugged the USB into my mac. This provided the Xbee with power and a com port to communicate with it. Once plugged in I opened cool term and created a new connection at 9600 baud and both hardware and software flow control turned off. In my port drop down I was able to choose the USB FTDI device. Once I hit connect I was able to start issuing some AT commands.
This is a great tutorial on how to configure the Xbee's. I recommend walking through this project first. This project will require two xbee USB explorer boards...or you can use the PI and set it up like I do below, then use a serial app like minicom to chat back and forth from your PC to your Pi.
For the first Xbee here is the settings I used.
+++OK #enabled command mode
ATID1 #set the network id
ATMY1 #this sets this Xbee's device ID to 1
ATDH0 #destination address Hi...not needed for our small network
ATDL2 #this is the Xbee device id we want to communicate with
ATWR #write the settings to the device
For the second XBee I used the following settings:
+++OK #enabled command mode
ATID1 #set the network id
ATMY1 #this sets this Xbee's device ID to 1
ATDH0 #destination address Hi...not needed for our small network
ATDL1 #this is the Xbee device id we want to communicate with
ATD0 #set the devices 0 pin to analog mode since the temp sensor is analog
ATIREA60 #Sample rate milliseconds in hex, so this is 60000 ms or 1 minute
ATIT10 #sets the unit to send 10 samples at once...this means it will send 10 readings every 10 minutes
ATWR #write the settings to the device
Here is a great reference of AT commands for the Xbee's.
Part Two - Wiring the Xbees
Setting up the sensor Now the Xbee's are ready to chat with each other and we need to wire them up. First up is the temperature sensing unit. I am going to use the USB explorer, a breadboard, and some wires to wire it up like this:

Here is what mine looks like after connecting everything together and setting it in the freezer.

Setting up the receiver I used the GPIO ribbon cable for the pi and used male to male prototyping wires. I also used the XBee breakout board. Here is the diagram:
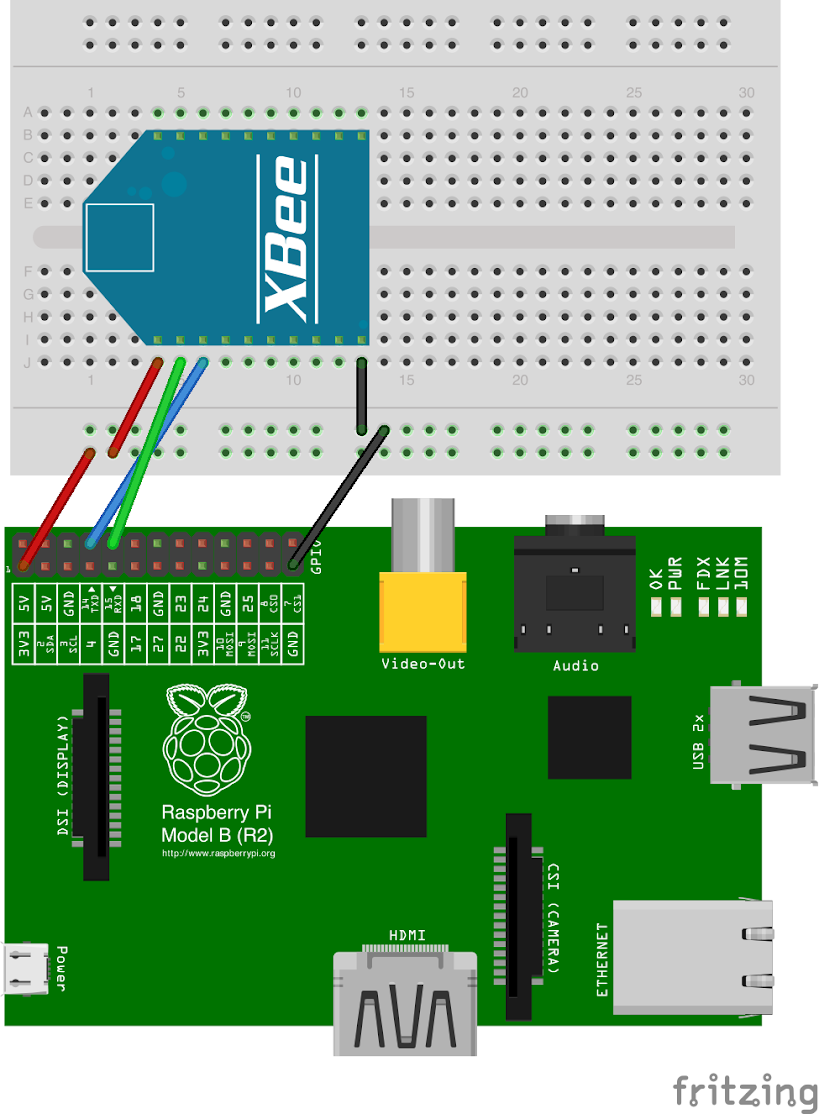
Here is what mine looked like:

Part Three - Software
The sensor side is ready to go and should be sending packets of data every 10 min to the PI. My Pi has the latest version of Rasbian on it. First I just wanted to see if I could read the data from the Xbee. For this I needed two python libraries: pyserial and xbee. Both were available via pip. Here is my app to read from the Xbee and print out the response.
import serial, time, datetime, sys
from xbee import XBee

SERIALPORT = "/dev/ttyAMA0"    # the com/serial port the XBee is connected to, the pi GPIO should always be ttyAMA0
BAUDRATE = 9600      # the baud rate we talk to the xbee

ser = serial.Serial(SERIALPORT, BAUDRATE)

xbee = XBee(ser)

print 'Starting Up Tempature Monitor'
# Continuously read and print packets
while True:
    try:
        response = xbee.wait_read_frame()
        print response
    except KeyboardInterrupt:
        break

ser.close()
If everything is setup properly you should see some output like this every 10 min or so:
Starting Up Tempature Monitor
{'rssi': 'O', 'source_addr': '\x00\x11', 'id': 'rx_io_data', 'samples': [{'adc-0': 214}, {'adc-0': 215}, {'adc-0': 215}], 'options': '\x00'}
{'rssi': 'O', 'source_addr': '\x00\x11', 'id': 'rx_io_data', 'samples': [{'adc-0': 215}, {'adc-0': 215}, {'adc-0': 215}], 'options': '\x00'}
{'rssi': 'O', 'source_addr': '\x00\x11', 'id': 'rx_io_data', 'samples': [{'adc-0': 214}, {'adc-0': 218}, {'adc-0': 218}], 'options': '\x00'}
{'rssi': 'L', 'source_addr': '\x00\x11', 'id': 'rx_io_data', 'samples': [{'adc-0': 216}, {'adc-0': 215}, {'adc-0': 213}], 'options': '\x00'}
The XBEE python library is great because we don't have to parse hexadecimal packets. In each dictionary we get these attributes:
- rssi - The signal strength
- source_addr - Which Xbee send the signal
- samples - an array of readings from each enabled IO pin. In this case pin 0 is sending 3 readings, you will see 10 readings if you configured your's the same as above.
- options - Not sure what options do yet
The readings in the samples array is the voltage the temperature sensor is sending to the Xbee. This now needs to be converted to a Celsius temperature. I had to do a ton of digging because the formulas I was finding just didn't make sense. It turns out it was different because I was using the 3.3V USB Explorer board. With that the formula was temp in c = ((voltage from sensor *3.2258) - 500) / 10.. In this formula the 3.2258 value represents the 3.3 volts of the USB board, which is feeding into the res pin as a reference. If you were using a different board value would be 1023 multiplied by the number of volts.
For my final version I wanted to log the temperature to a SQLLite database file. I wanted to log the timestamp, temp and which sensor it came from (cause there will eventually be more than one). Here is my final logging app:
import serial, time, datetime, sys
from xbee import XBee
import time
import sqlite3


#get the current temp from a list of voltage readings
def get_tempature(data, format="C"):
    #iterate over data elements
    readings = []
    for item in data:
        readings.append(item.get('adc-0'))

    #start by averaging the data
    volt_average = sum(readings)/float(len(readings))

    #now calculate the proper mv
    #we are using a 3.3v usb explorer so the formula is slightly different
    tempature = ((volt_average*3.2258) - 500) / 10.0

    if format=="F":
        #convert to farenheit
        tempature = (tempature * 1.8) + 32

    return tempature


#save the reading to the sqllite db
def save_temp_reading (zonestr, temp):
    # I used triple quotes so that I could break this string into
    # two lines for formatting purposes
    curs.execute("INSERT INTO tempature_log values( (?), (?), (?) )", (int(time.time()), zonestr,temp))

    # commit the changes
    conn.commit()

SERIALPORT = "/dev/ttyAMA0"    # the com/serial port the XBee is connected to
BAUDRATE = 9600      # the baud rate we talk to the xbee
TEMPSENSE = 0       # which XBee ADC has current draw data
ROOM = "Room1"  # for now, when we add a second unit we will change this

conn=sqlite3.connect('tempature.db')

curs=conn.cursor()

ser = serial.Serial(SERIALPORT, BAUDRATE)

xbee = XBee(ser)
print 'Starting Up Tempature Monitor'
# Continuously read and print packets
while True:
    try:
        response = xbee.wait_read_frame()
        #print response
        tempature = get_tempature(response['samples'], format="F")

    #print our timestamp and tempature to standard_out
    #print "{0}, {1}".format(int(time.time()), tempature)

    #save the tempature to the databse
    save_temp_reading(ROOM, tempature)

    except KeyboardInterrupt:
        break

ser.close()
I ended up using supervisord to manage/daemonize the process. I sent stdout and stderror to a log file.
Now that I have the temperature logged in a sqllite db, I want a nice we interface with a d3 graph showing the trend and the current temp. For this I used a flask webserver and one simple jinja template. Here is the main app.py webserver:
from flask import Flask, Response, g, render_template
import sqlite3
import json
import time


app = Flask(__name__)

app.config.update(
    DEBUG=True,
    PROPAGATE_EXCEPTIONS=True
)

DATABASE = '../tempature.db'


def get_db():
    db = getattr(g, '_database', None)
    if db is None:
        db = g._database = sqlite3.connect(DATABASE)
    return db


#select the last entry from the database
def get_current_temp():

    cur = get_db().cursor()
    cur.execute("select * from tempature_log order by timestamp desc limit 1")

    rows = cur.fetchall()

    for row in rows:
        timestamp = row[0] - (60*60*6)
        temp = row[2]

    return temp


@app.teardown_appcontext
def close_connection(exception):
    db = getattr(g, '_database', None)
    if db is not None:
        db.close()


#define the index page, which only needs the current temp to render
@app.route('/', methods=['GET'])
def get_index():
    return render_template('index.html', current_temp = get_current_temp())


#get temps is used via an ajax call with d3.js, to render the graph
@app.route('/get_temps', methods=['GET'])
def get_temp_json():

    return_array = []

    time_range = int(time.time()) - (60*60*24.0) #grab the last 24 hours
    cur = get_db().cursor()
        cur.execute("SELECT * FROM tempature_log WHERE timestamp > ?", (time_range, ))

        rows = cur.fetchall()

        for row in rows:
        timestamp = row[0] - (60*60*6)
            temp = row[2]
        return_array.append({'x': timestamp, 'y': temp})

    response = Response(json.dumps(return_array))
    return response


#start the app/webserver
if __name__ == "__main__":
    app.run(host='0.0.0.0', port=80, debug=True)
This is my index.html jinja template that includes the d3.js code:
<!DOCTYPE html>
<html lang="en">
<head>
<meta charset="utf-8">
<meta http-equiv="X-UA-Compatible" content="IE=edge">
<meta name="viewport" content="width=device-width, initial-scale=1">
<meta name="description" content="">
<meta name="author" content="">
<link rel="shortcut icon" href="../../assets/ico/favicon.ico">
<title>Narrow Jumbotron Template for Bootstrap</title>
<!-- Bootstrap core CSS -->
<link href="static/bower_components/bootstrap/dist/css/bootstrap.min.css" rel="stylesheet">
<!-- Custom styles for this template -->
<link href="static/bower_components/bootstrap/dist/css/jumbotron-narrow.css" rel="stylesheet">
<!-- RickShaw CSS -->
<link rel="stylesheet" type="text/css" href="static/bower_components/rickshaw/rickshaw.css">
<script src="https://ajax.googleapis.com/ajax/libs/jquery/1.8.1/jquery.min.js"></script>
<script type="text/javascript" src="static/bower_components/rickshaw/vendor/d3.min.js"></script>
<script type="text/javascript" src="static/bower_components/rickshaw/vendor/d3.layout.min.js"></script>
<script type="text/javascript" src="static/bower_components/rickshaw/rickshaw.min.js"></script>
<!-- Just for debugging purposes. Don't actually copy this line! -->
<!--[if lt IE 9]><script src="../../assets/js/ie8-responsive-file-warning.js"></script><![endif]-->
<!-- HTML5 shim and Respond.js IE8 support of HTML5 elements and media queries -->
<!--[if lt IE 9]>
<script src="https://oss.maxcdn.com/libs/html5shiv/3.7.0/html5shiv.js"></script>
<script src="https://oss.maxcdn.com/libs/respond.js/1.4.2/respond.min.js"></script>
<![endif]-->
<style>
#chart_container {
position: relative;
font-family: Arial, Helvetica, sans-serif;
margin: 30px 0;
}
#chart {
position: relative;
left: 40px;
}
#y_axis {
position: absolute;
top: 0;
bottom: 0;
width: 40px;
}
</style>
</head>
<body>
<div class="container">
<div class="header">
<ul class="nav nav-pills pull-right">
<li class="active"><a href="#">Home</a></li>
</ul>
<h3 class="text-muted">Temperature Sensor Project</h3>
</div>
<div class="jumbotron">
<h2>Raspberry Pi Temperature Project</h2>
<h4>Current temp is <span id="temp"></span>.</h4>
<div id="chart_container">
<div id="y_axis"></div>
<div id="chart"></div>
</div>
</div>
<div class="footer">
<p>© BrettDangerfield.com 2014</p>
</div>
</div> <!-- /container -->
<!-- Bootstrap core JavaScript
================================================== -->
<!-- Placed at the end of the document so the pages load faster -->
<script>
var graph = new Rickshaw.Graph.Ajax( {
        element: document.querySelector("#chart"),
        width: 540,
        height: 240,
        min: 74,
        max: 82,
        dataURL: '/get_temps',
        onData: function(data) {
            return [{
                name : "Tempature",
                color: "steelblue",
                data: data
            }];
            // or simply return [data[0].strokeVolume_count]; since it looks like a series object already
        },

        onComplete: function() {

            var x_axis = new Rickshaw.Graph.Axis.Time({
              graph: this.graph
            });
            x_axis.graph.update();

            var hoverDetail = new Rickshaw.Graph.HoverDetail( {
                graph: this.graph
            } );

            var y_ticks = new Rickshaw.Graph.Axis.Y( {
                graph: this.graph,
                orientation: 'left',
                tickFormat: Rickshaw.Fixtures.Number.formatKMBT,
                element: document.getElementById('y_axis')
            } );


            this.graph.render();
        }
    } );
</script>
</body>
</html>
I used Rickshaw to make dealing with d3 easier. The graph was pretty simple. I just defined the size, y-min and max and where to get the data. In the onComplete callback I just setup the x-axis to be a time-based axis, added hover data and turned on the y axis ticks.
var graph = new Rickshaw.Graph.Ajax( {
element: document.querySelector("#chart"),
width: 540,
height: 240,
min: 74,
max: 82,
dataURL: '/get_temps',
onData: function(data) {
return [{
name : "Tempature",
color: "steelblue",
data: data
}];
// or simply return [data[0].strokeVolume_count]; since it looks like a series object already
},
onComplete: function() {
var x_axis = new Rickshaw.Graph.Axis.Time({
graph: this.graph
});
x_axis.graph.update();
var hoverDetail = new Rickshaw.Graph.HoverDetail( {
graph: this.graph
} );
var y_ticks = new Rickshaw.Graph.Axis.Y( {
graph: this.graph,
orientation: 'left',
tickFormat: Rickshaw.Fixtures.Number.formatKMBT,
element: document.getElementById('y_axis')
} );
this.graph.render();
}
} );
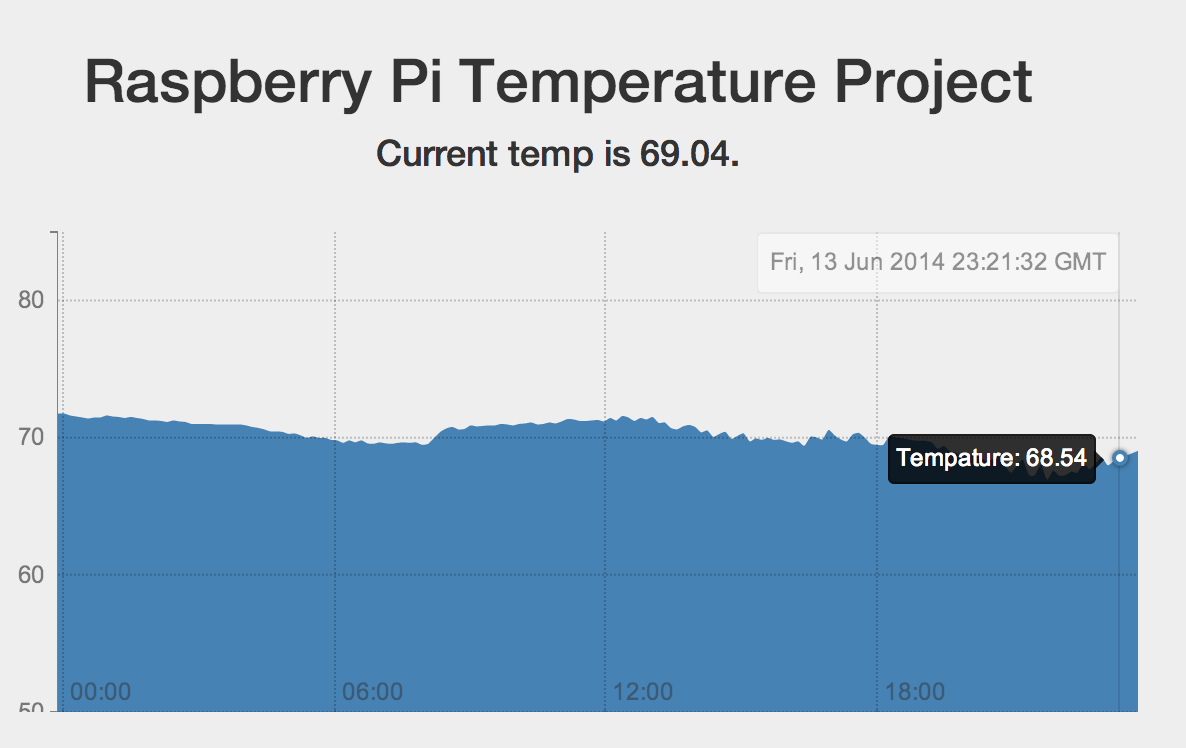
Now when I start the webserver (as sudo since I am using port 80) and navigate to the pi's ip in a browser, I get this nice page:
Awesome! It Works!!
Part Four - Soldering and hardening
Now that everything is working, I want to be able to put this device in my kid's room without it being so fragile. For this I bought a $3 box from radioshack and drilled a hole for the USB cable and sensor. I also soldered the temp sensor to the USB explorer board. Here is what that looks like:


What's Next
Now that I have a working prototype I would like to build one or two more sensors and modify the graph to show the trend of each location overlayed on top of each other. I would also like to be able to change the date range and zoom in and out on the graph. Eventually, I would like to get a network enabled thermostat and have my pi turn the heat/ac on or off based on location, time of day, temp ect. Maybe build some smart rules to control the climate in my house. The single thermostat reading just doesn't cut it because the temp varies so much from room to room.
Here is the source code from github: